Governance, Risk + Compliance
Ensure resilience and balance risks and rewards to manage for the future
Digital
Deliver value to your customers smarter and faster and thrive in the digital economy of today and tomorrow.
Customer Experience
Real, data-driven insight drives extraordinary experiences that attract and retain the best customers.
Managing Risk in a Complex World
Quantitative risk management (QRM) is a necessary requirement for true enterprise risk management (ERM) because it renders all sources of a company’s risk in the same language of dollars and cents. From traditional finance, operational and compliance risks to the unending risks introduced by technology, risk managers of the future must not only account for these risks alone but understand and model their interrelations to provide a complete and accurate picture of a firm’s risk posture.
Further, understanding how mitigating and managing one risk impacts others will be critical in reducing ever growing compliance costs for increasingly complex organizations that operate in diverse and widespread markets. Despite being rife with data produced through operations and security management, information technology has been late in adopting true quantitative risk measures. The goal of enterprise risk management should be to close the gap between highly quantitative financial risk management practices & the compliance focused management of information security and other IT risks.
Why QRM + Where are we?
Infoedge used these criteria to ensure that each use case was in alignment with the client’s overall goals and could be feasibly implemented within their current framework. Their strategic willingness assessment made certain each use case contributed to the client’s mission, while the internal readiness evaluation ensured that the client could incorporate the necessary changes effectively.
The firm also assessed the market maturity of each use case, examining the product’s maturity and the current and future capabilities of the vendor. This ensured that each solution was technologically sound and had the potential to provide long-term benefits.
Lastly, a thorough business case assessment was carried out, considering the potential cost savings and revenue generation benefits that could be achieved through each use case. Infoedge emphasized the financial viability of each proposed solution, ensuring that the return on investment would justify the expenditure.
Translating IT Risk into Dollars and Cents
Quantifying IT risk requires knowing how IT risks impact the organization, a detailed understanding of where the risks originated, and a full accounting of the response and mitigation efforts. In effect our quantitative approach assumes that organizations, like natural systems, have non-random structure (organization & processes) against which risks and their impacts can be reconciled. By mapping the structure, we can develop predictive and explanatory frameworks for understanding the effects of mitigation (i.e. modifying said structure) on the probability of risk occurrence and the resulting impact. At S.I. quantifying response and mitigation costs was straight forward as S.I., like many other large enterprises, has invested much in tracking productivity (e.g. people and processes) and tools (e.g. technologies) used to mitigate and respond to a realized risk once an IT incident has occurred. By mining these data, we were able to develop the necessary information on the “direct” costs, response and mitigation, of IT risk management. Understanding the true value of risk mitigation requires not only knowing these values but understanding how and why risks materialize as incidents (e.g. risk origination and tracing).
The answers rarely point to singular sources or simple mappings, however. Our next task was to build organization & process maps or “topologies” and create a detailed organizational process model. This model was then used to trace IT incidents and determine not only the direct and indirect causes but the real costs, or business value, of the controls themselves.
Our Approach
We mapped groups and processes within the organization involved in enabling and using IT systems. From business partners, 3rd party contractors and internal project teams to enterprise architects we developed a detailed organizational process model by leaning on insights from modern information theory. Using this model or topology and information from traditional root cause analysis of past events we were able to map program and project weakness, down to the group or process level. In doing so we developed an understanding of the total value of risk management activities. For example, we found that some robust front-line security spending was likely covering poor application development and project management (e.g. operational risks) that allowed vulnerable applications to be deployed.
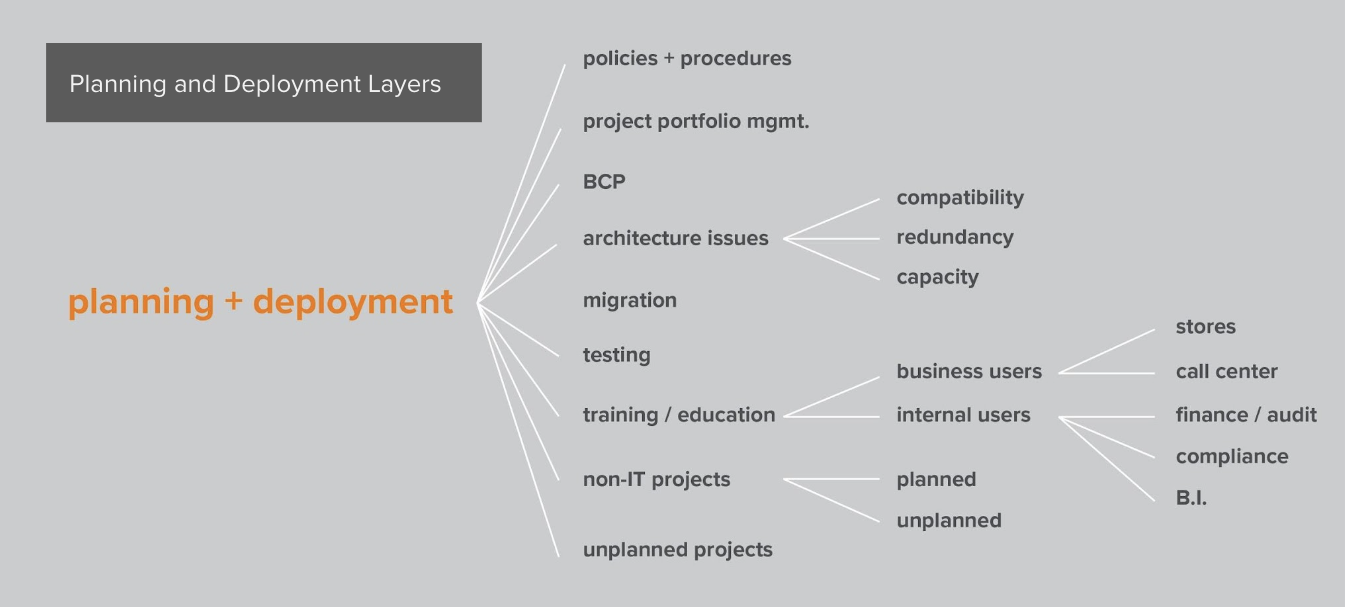
Figure 1: Example of organization and process mapping for planning and deployment at S.I.
Last, we had to link these data and models to enterprise level business impacts (e.g. fully realized revenue impacts or “costs”). Business costs due to IT failures are often difficult to calculate. This can be due to the fact that the value of technologies to business partners is often not well understood by those managing enterprise technologies and rarely static. To illustrate this, take a credit card processing system.
Depending on the technical configuration and business processes, loss of such an application for days could have negligible impact on the bottom line of a business if there are alternative methods of processing, despite introducing many compliance risks, while another business might see material losses after only an hour or two. Understanding these details for all IT risks is critical. However, developing such a view might be costly if every application and system required a recurring detailed business audit to determine the critical variables before rolling these up into an enterprise view of potential losses due to identified risks. Instead we utilized risk exceedance models to build an enterprise view from a sampling of actualized risks across some of the most used IT systems.
These models can predict the total expected loss due to both common events (low cost, high probability incidents) as well as headline grabbing attacks (low probability, high cost events) with accuracy by drawing on the assumption that all risks to an organization are mediated through the same “structure” (e.g. people, processes & technology) and so there would be some underlying mathematical relations to uncover with data analysis.
Complete Results
Fitting “HILF” Events
Armed with a powerful new exceedance model S.I. was able to compare the value of their IT security spend to competitors. In doing so they were able to determine that by spending significantly more on cybersecurity tools they were reducing loss by $2M per year compared to a peer group (mostly from fewer moderate level events resulting in system outages and less spend on incident response for common, low impact events). Further, by taking the same approach we looked at system or application loss depending on project development features. For example, our data analysis found that agile development led to half the loss for deployed applications compared to those developed using waterfall & ad hoc project management methods.
Further, agile projects were less likely to lead to cost overruns. As a result, S.I. moved more aggressively toward agile projects that free up budget on the front end through reduced cost overruns and on the back-end with fewer losses due to security or IT operations incidents caused by avoidable vulnerabilities or unnecessary features. The value of improved project management was found to be at least $1.5M annually and up to $3M to $4M in years with especially large application deployments.
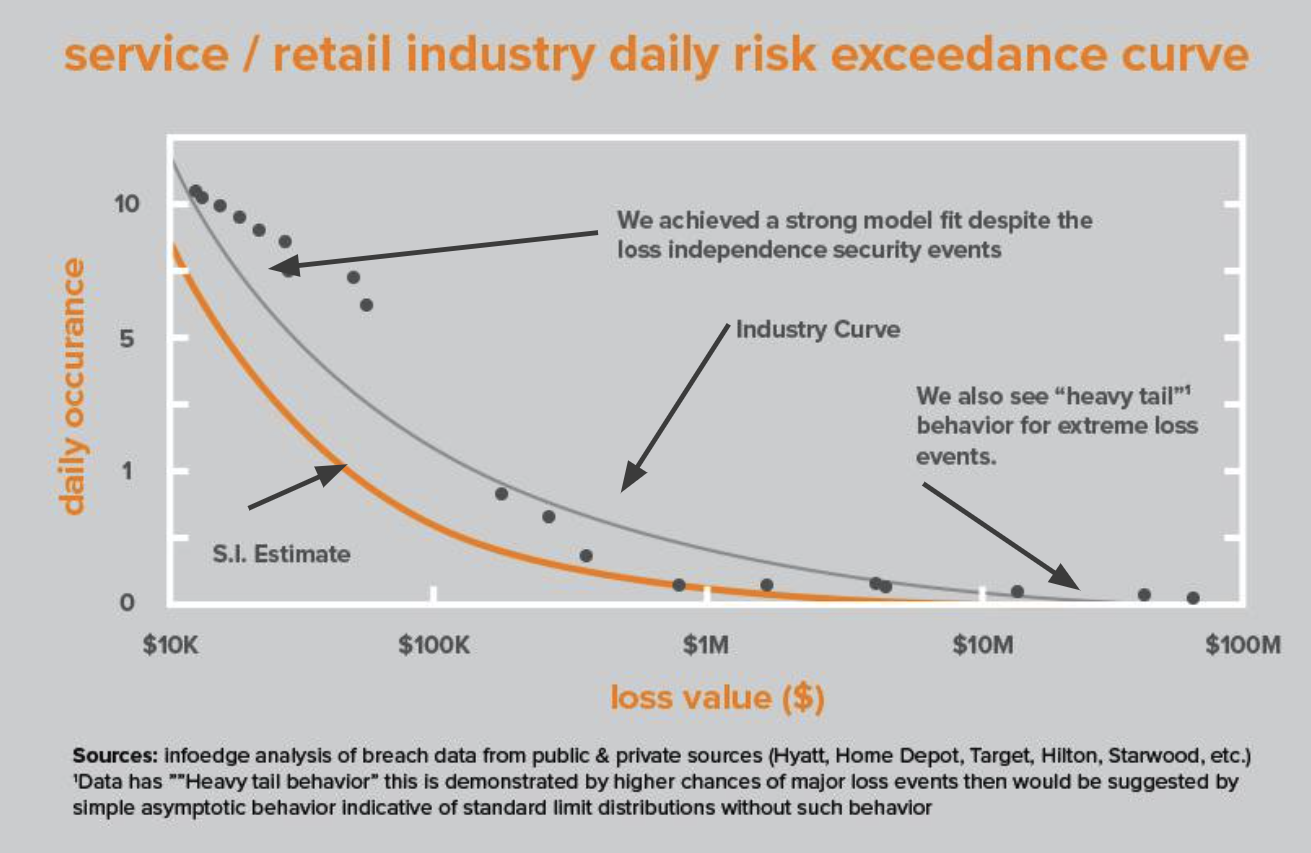
Figure 2: Example of risk exceedance curve. Comparing incidents at client S.I. to peers allowed for estimates of annual losses before building an internal exceedance model based primarily on prior years of S.I. security and other IT incident data.
Another example was asset management. Our analysis found nearly $1M in actualized risk could be prevented with a more robust asset management program that would forestall incidents caused by aging, often inexpensive, physical assets that were beyond their effective lifespan. S.I., by adopting a program similar to those we see at other enterprises (often only $250-500K annually), would reduce annual expected losses (e.g. residual risk) by $1M or more while reducing operational risks.
Additionally, we were able to develop expected loss models to fit currently used qualitative threat models like STRIDE to provide quantitative information in a format already familiar to risk managers and executives. The result will allow S.I. to right size security tool investments based on the real business impact of residual risks. Last, like many companies, S.I. manages the risk of High-Impact Low-Frequency (HILF) events by purchasing expanded cyber insurance.
Utilizing the models we developed to determine the most likely worst case scenario, they can move to right size their insurance policy because they are now able to better predict likely maximum annual losses. Many companies are at the whims of their insurer who often have much less insight into the threats they are insuring against, the results are often expensive premiums and policies with so many exceptions as to be useless in the event of a catastrophic IT incident.
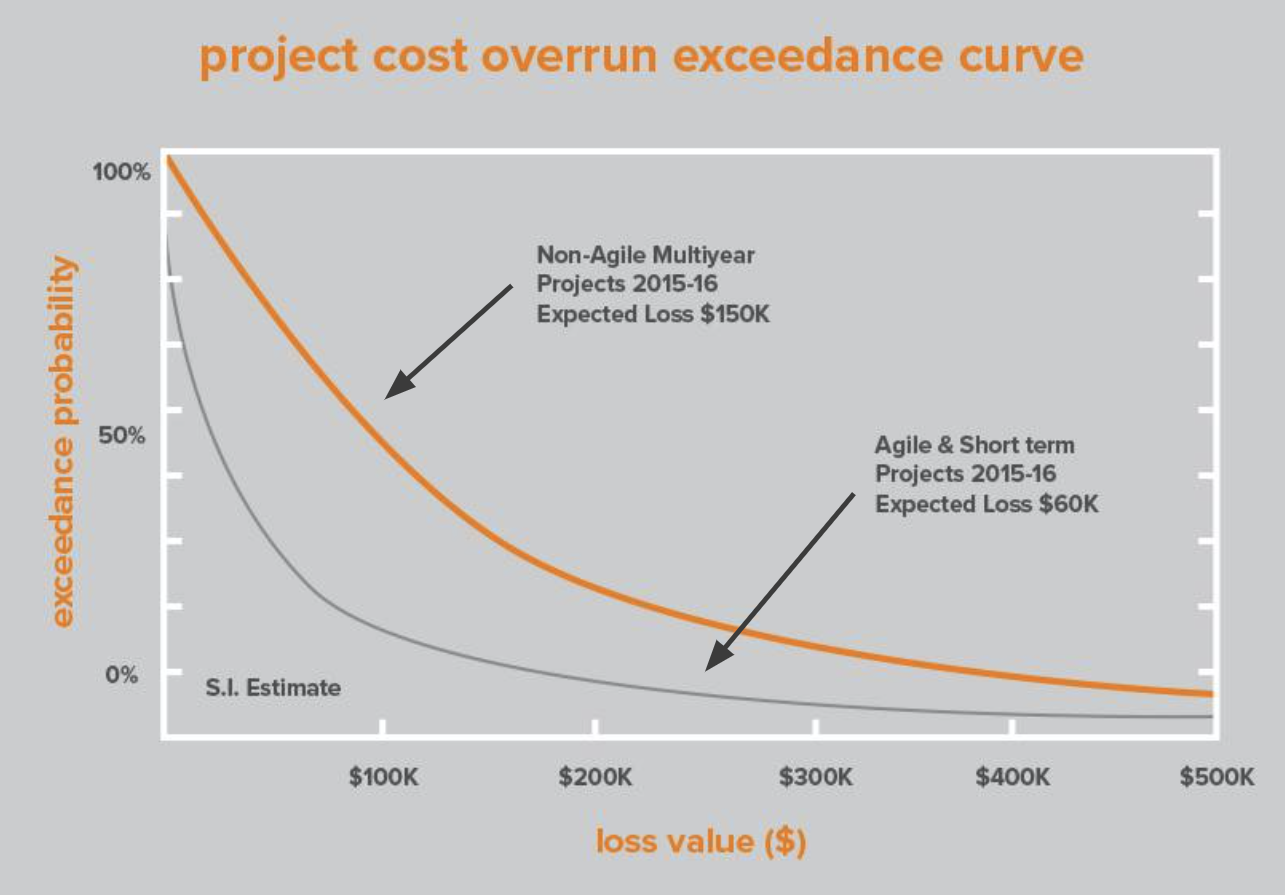
Figure 3: Risk of cost overruns at S.I. by project type. Agile and short-term projects (gray) were much less likely to result in cost overruns than non-agile (orange) projects. On average there is $90k value gap between projects closed within a year and complex multi-year projects.
Another example was asset management. Our analysis found nearly $1M in actualized risk could be prevented with a more robust asset management program that would forestall incidents caused by aging, often inexpensive, physical assets that were beyond their effective lifespan. S.I., by adopting a program similar to those we see at other enterprises (often only $250-500K annually), would reduce annual expected losses (e.g. residual risk) by $1M or more while reducing operational risks.
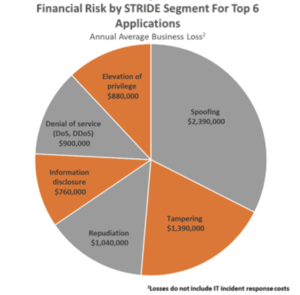
Additionally, we were able to develop expected loss models to fit currently used qualitative threat models like STRIDE to provide quantitative information in a format already familiar to risk managers and executives. The result will allow S.I. to right size security tool investments based on the real business impact of residual risks. Last, like many companies, S.I. manages the risk of High-Impact Low-Frequency (HILF) events by purchasing expanded cyber insurance.
Utilizing the models we developed to determine the most likely worst case scenario, they can move to right size their insurance policy because they are now able to better predict likely maximum annual losses. Many companies are at the whims of their insurer who often have much less insight into the threats they are insuring against, the results are often expensive premiums and policies with so many exceptions as to be useless in the event of a catastrophic IT incident.
Conclusion
Our work for S.I. assessing the full business impact of IT risks within the organization is a first step toward quantified IT risk management and a prerequisite for true ERM. Further, by mapping the environment we provide a framework for how risks flow from one part of the enterprise (e.g. application development) to others (e.g. IT operations or finance). Our clients are often amazed at the level of insight this seemingly simple exercise provides risk managers and executives. Last, this work helped change the mindset of the IT risk managers so that they could more easily see how operational risk in the back office or in project development can lead to increased IT security exposure. On the flip side they could finally discuss with confidence the value they provided by understanding how their IT security spend closed very real gaps created upstream by business partners and other project stakeholders.
As companies like S.I. mature the quantitative risk function, we see many opportunities to make risk management an integral part of decision making. It is not just an expense but a way to improve the bottom line. Armed with the right quantitative tools, risk managers of the future will be sought after experts who enable management to be creative and dynamic rather than limit their choices. To advance QRM practices, firms will need to do things like improve their data management processes and systems to reduce the cost and time of analyzing critical data for understanding both loss and tracing realized risks.
Companies must also continue to embrace automation & enterprise analytics to eventually support “real time” risk measures that will allow management to respond faster to threat landscapes that change with the pulse of business. Additionally, firms will have to continue investments in visualization and data visibility, from the analyst to the the executive levels, to enable stakeholders to communicate business decisions in quantitative terms no matter the issue. It will take these types of advances, as well as many others, to produce the type of unified quantitative ERM programs that have long been envisioned.